Sankhya Infotech Ltd
Share Price - 44.3
Listed On - BSE(532972)
Sector - Software(Medium and Small)
Technical Chart Study:
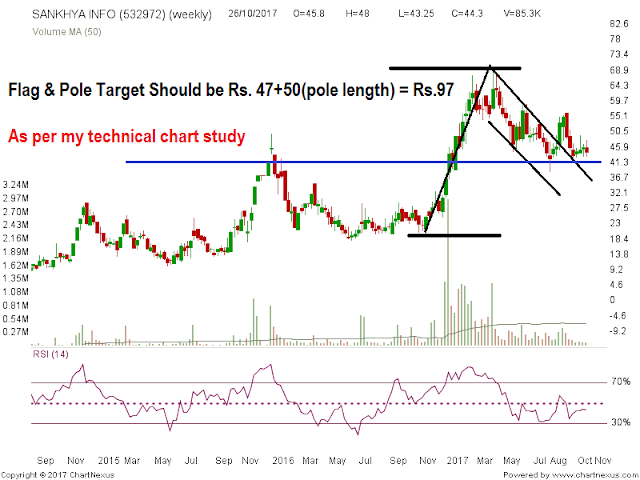
As per my technical chart study Sankhya Infotech Ltd is formed and breakout superb Flag pattern. After Flag pattern breakout it has been consolidating from last few weeks and now its touched the support line which was its Flag resistance line. As per technical chart, it has superb support at Rs. 41.30 level and after that Rs. 38 is final powerful support level which should not break. Now watch the chart and try to learn from it.
Now I am going to express my another point of view which I noticed in Sankhya chart. I noticed Sankhya is moving through a good channel and now it can ready to break out the channel resistance line anytime. But according to technical rules, one should not an entry in any stock before a good technical breakout. As per technical chart Rs. 50-51 is wonderful channel resistance level and expecting a break out soon. After the break out of that level, final trend changing indication should be at Rs. 56.5. I am sharing the chart and hope you can learn from it easily.
I want to discuss this stock only basis on the technical chart. If you asked me about it's fundamental then I would like to tell Sankhya is a fundamentally good company and I like its fundamental data. It's gradually improving and expecting good growth in near future also. As I believe technical chart always gives an early indication of company's future growth and prospect.
Please comment and follow me if you have any query and really like my blog.
Share Price - 44.3
Listed On - BSE(532972)
Sector - Software(Medium and Small)
Technical Chart Study:
As per my technical chart study Sankhya Infotech Ltd is formed and breakout superb Flag pattern. After Flag pattern breakout it has been consolidating from last few weeks and now its touched the support line which was its Flag resistance line. As per technical chart, it has superb support at Rs. 41.30 level and after that Rs. 38 is final powerful support level which should not break. Now watch the chart and try to learn from it.
Now I am going to express my another point of view which I noticed in Sankhya chart. I noticed Sankhya is moving through a good channel and now it can ready to break out the channel resistance line anytime. But according to technical rules, one should not an entry in any stock before a good technical breakout. As per technical chart Rs. 50-51 is wonderful channel resistance level and expecting a break out soon. After the break out of that level, final trend changing indication should be at Rs. 56.5. I am sharing the chart and hope you can learn from it easily.
 |
| Sankhya Infotech Ltd |
Please comment and follow me if you have any query and really like my blog.


7 Comments
Click here for CommentsBiplab ji, as always, your technical analysis is top class. Learnt a lot from your posts and videos. I am invested in Sankhya from 22 levels. Holding without worry for the story to unfold. Your post reaffirms my conviction. Thank you so much.
ReplyI am fortunate enough to come across this great technical blog. You are amazing to read technicals. Would like to see great technical insights. Great sir
ReplySir your charts are great. Kindly let us know your email Id if possible so that we can ask query.
ReplyI have written an article on 1 best stock from the Indian stock market. This can help your consumer or visitors. So if possible you can give Backlink to my website.
ReplyHey, thanks for the information. your posts are informative and useful.
ReplyTata Group Stocks
Watch out in 2020
TRENT LTD
TOYAMA ELECTRIC LTD
Hey, thanks for the information. your posts are informative and useful.
ReplyMarket and Economy
Prince Pipes IPO
Titan Company Ltd
Tata Motors Ltd
Your Blog is very nice.Each of these fund houses best trading app in india offers different schemes for equity, debt, hybrid, and sectoral investments.
Replymutual fund company in india
best trading app in india
mutual fund investment plans
sip investment plan calculator